Audio Specs That Matter: SNR, Dynamic Range & More Explained
When you’re buying audio gear, focus on frequency response over flashy specs-a flat curve from 20Hz to 20kHz matters more than extreme range extensions that you’ll never hear. Signal-to-noise ratio should exceed 70dB for consumer devices, while dynamic range above 106dB preserves musical detail in quiet passages. Don’t obsess over total harmonic distortion numbers since they’re often subjective, and prioritize crosstalk measurements below -60dB for proper stereo imaging. Understanding these core specifications will help you make smarter purchasing decisions and avoid marketing gimmicks.
We are supported by our audience. When you purchase through links on our site, we may earn an affiliate commission, at no extra cost for you. Learn more.
Notable Insights
- Flat frequency response (20 Hz-20 kHz) matters more than extended range for accurate, uncolored sound reproduction.
- Signal-to-noise ratio above 70-80 dB ensures clear audio with minimal background interference in consumer devices.
- Dynamic range of 106 dB or higher preserves detail between loud and quiet sounds effectively.
- 24-bit depth provides superior audio resolution and 144 dB dynamic range compared to 16-bit recordings.
- Speaker sensitivity above 90 dB requires less amplifier power while crosstalk below -60 dB maintains stereo imaging.
Frequency Response: The Foundation of Accurate Sound Reproduction
Precision-that’s what separates exceptional audio equipment from the mediocre stuff cluttering most people’s shelves, and I’ve spent enough years testing gear to know that frequency response serves as the fundamental metric determining whether you’ll hear your music as the artist intended or through a veil of electronic compromise.
When you’re examining frequency response graphs, you’re practically looking at how accurately a device reproduces sound across the entire 20 Hz to 20 kHz range your ears can perceive.
That flat line across frequencies? That’s the gold standard for audio fidelity, ensuring bass drums hit with proper weight, vocals maintain natural warmth, and cymbals retain their shimmer without harsh peaks that’ll make you wince during extended listening sessions.
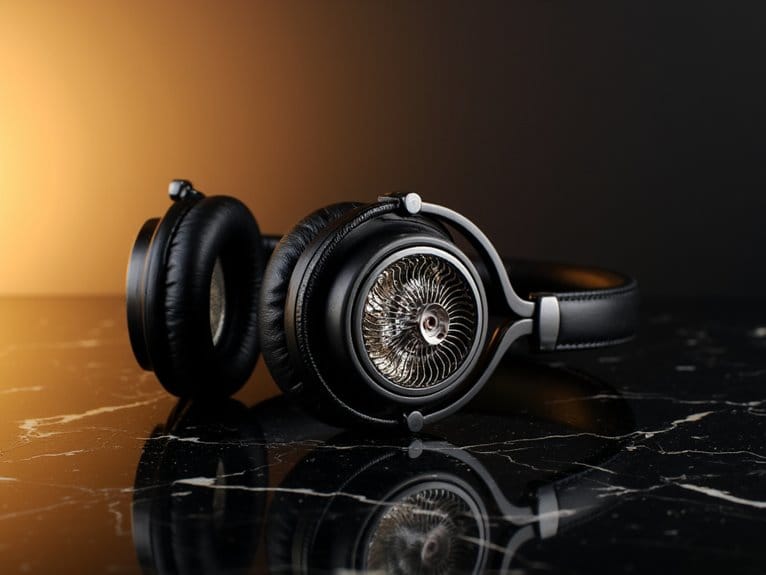
Professional headphones like the Sony MDR7506 exemplify this principle with their flat frequency response, minimizing artificial enhancements to deliver the accurate sound reproduction that audio engineers rely on for critical listening tasks. Understanding how equipment specifications impact your signal-to-noise ratio becomes crucial when you’re pursuing that level of professional audio quality, as even minor electronic interference can compromise the pristine sound reproduction you’re seeking.
Why Flat Response Curves Matter More Than Extended Range
You might think that speakers with the widest frequency range automatically deliver the best sound, but I’ve learned through years of testing that a flat response curve across a moderate range consistently outperforms extended frequency specs with uneven output levels.
When you’re evaluating speakers, the diminishing returns of ultra-wide frequency extension become apparent once you realize that accurate reproduction of audible frequencies matters far more than reaching those impressive-sounding sub-20Hz or above-20kHz numbers.
Studio monitors demonstrate this principle perfectly, as their linear requirements prioritize consistent output across the working frequency range rather than chasing extreme low or high-frequency extension that often introduces unwanted coloration. Open-back headphones follow this same philosophy, delivering uncolored audio that mirrors the original recording rather than emphasizing certain frequencies like their closed-back counterparts.
Professional monitors like the Yamaha HS5 achieve this balance with a flat frequency response of 54Hz-30kHz, proving that moderate ranges with accurate reproduction outperform wider specs with uneven output.
Accurate Sound Reproduction Benefits
When most audio enthusiasts start shopping for speakers or headphones, they’re immediately drawn to impressive frequency range specifications-those eye-catching 20Hz to 20kHz numbers that promise earth-shaking bass and crystal-clear highs.
However, I’ve learned that accurate sound reproduction matters far more than extended range, and here’s why vital fidelity trumps flashy specs every time.
Flat response curves guarantee you’re hearing exactly what the artist intended, without unwanted coloration that masks instrument timbre or creates listener fatigue.
When your audio equipment maintains consistent output across frequencies, you’ll experience better spatial accuracy, improved soundstage localization, and reduced ear strain during extended listening sessions.
This becomes particularly essential for audio professionals who need reliable, uncolored sound for mixing decisions that translate well across different playback systems.
Professional monitoring headphones like the Sony MDR7506 feature 40mm neodymium drivers that deliver the flat frequency response crucial for accurate sound detection and mixing applications.
Professional monitoring headphones with sensitivity ratings around 105 dB or higher provide the accuracy needed for critical listening applications where every detail matters.
Extended Range Diminishing Returns
Why do manufacturers continue pushing frequency specifications far beyond human hearing when most listeners can’t even perceive the difference? The answer often lies in marketing rather than meaningful performance gains, as diminishing returns kick in well before those impressive-looking specification sheets suggest.
I’ve tested countless speakers claiming frequency extension to 40 kHz or beyond, yet the audible improvements over well-designed models stopping at 20 kHz remain negligible under normal listening conditions. Your ears simply can’t detect those ultra-high frequencies, and most audio content doesn’t contain them anyway.
Instead of chasing extended range specifications, you’ll notice far greater improvements from speakers with flat response curves across the standard audible spectrum, ensuring accurate reproduction without the premium pricing that frequency extension typically demands. Professional audio engineers consistently choose headphones with flat frequency response because it minimizes artificial enhancements that can mask critical details during recording and mixing sessions.
The same principle applies to microphones, where models like the Audio-Technica AT2020 demonstrate that superior frequency response across the audible range delivers professional results without extending into inaudible frequencies.
Studio Monitor Linear Requirements
While impressive frequency extension numbers grab attention on specification sheets, studio monitors achieve their legendary accuracy through meticulously flat response curves that prioritize linearity over range.
When you’re evaluating monitors, look for specifications showing ±1.5 dB deviation across mid-to-high frequencies, typically from 60 Hz to 19 kHz, because this flat frequency response prevents misleading boosts that cause poor mixing decisions.
I’ve witnessed countless engineers struggle with monitors that emphasize certain frequencies, leading to mixes that sound unbalanced on consumer systems. Linear performance guarantees you’re hearing exactly what’s recorded, without coloration that might mask phase issues or dynamic range problems.
This consistency matters more than extended bass or treble because accurate reproduction, not impressive extremes, creates reliable mixing environments. Professional mixers like the Yamaha MG16XU feature studio-quality discrete class-A preamps that complement monitor accuracy by maintaining signal integrity throughout the audio chain.
Signal-To-Noise Ratio: Separating Music From Background Hiss
When you’re evaluating headphones or speakers, you’ll encounter Signal-to-Noise Ratio specifications that reveal how well your music separates from unwanted background hiss, static, and electronic interference that can muddy your listening experience.
I’ve found that SNR values above 70 dB typically deliver acceptable performance for most consumers, while audiophiles and professional applications often demand 90 dB or higher to guarantee pristine sound reproduction without audible noise contamination.
You’ll notice this specification becomes particularly important in quiet passages, where poor SNR allows background noise to creep into your music, masking subtle details and reducing the overall clarity that separates good audio equipment from mediocre alternatives.
Professional audio mixers employ signal flow techniques to maintain optimal signal-to-noise ratios as audio travels from input preamps through various processing stages to the final output destination.
Quality preamps boost microphone signals to usable levels while maintaining excellent signal-to-noise ratios, making them essential components in any recording chain where pristine audio capture is the goal.
What SNR Measures
The heartbeat of any audio system lies in its ability to deliver pure sound without the annoying hiss that can turn your favorite song into a frustrating listening experience.
SNR interpretation reveals how effectively your equipment separates desired signals from unwanted background noise, directly impacting audio clarity during critical listening sessions.
When I evaluate measurement methods, I focus on comparing signal power against noise floor levels, which helps identify problematic noise sources within your signal chain.
Modern equipment design prioritizes maintaining signal integrity through careful component selection, while production techniques emphasize controlling environmental factors that compromise recordings.
Understanding these practical applications allows you to make informed decisions about gear purchases, ensuring your audio setup delivers the clean, professional sound quality you’re seeking.
Acceptable SNR Values
As you dive deeper into SNR specifications, understanding what constitutes acceptable value indicators becomes essential for making informed purchasing decisions that’ll actually impact your listening experience.
For basic functionality, you’ll need at least 15-25 dB, though this range still carries noticeable interference that’ll frustrate most listeners. Consumer audio equipment requires considerably higher standards-portable devices targeting casual users aim for 70-80 dB, while smartphones typically deliver 60-90 dB performance.
Your listener noise tolerance plays an important role here, as individual preferences vary considerably between music and speech content. High-end audio interfaces boast SNR ratings exceeding 100 dB, virtually eliminating perceptible background hiss, while budget equipment under 50 dB introduces audible noise that becomes particularly noticeable during quiet passages.
Real-World Noise Impact
Beyond the clean specifications listed on product datasheets, I’ve discovered that real-world listening environments present a complex web of noise sources that can transform even premium audio equipment into mediocre performers.
Your listening room’s HVAC system, electromagnetic interference from nearby electronics, and structural vibrations create an audio battleground where theoretical SNR numbers become meaningless.
Effective noise reduction techniques and sound isolation methods include:
- Positioning microphones closer to sources while using directional patterns
- Installing proper cable shielding to minimize electromagnetic interference
- Implementing mechanical isolation through shock mounts and vibration dampeners
- Selecting wireless frequencies away from crowded spectrum areas
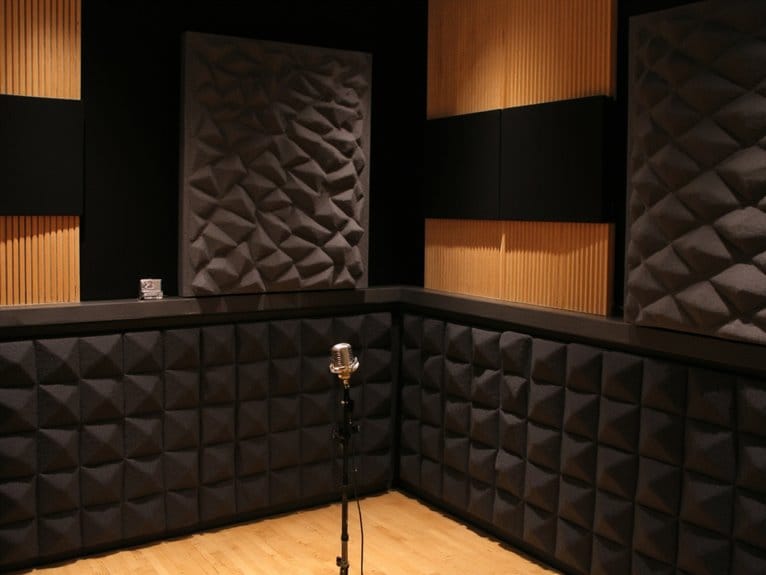
- Using acoustic treatment to control environmental reflections and ambient noise
These environmental factors explain why your expensive headphones might sound disappointing in certain rooms.
Professional audio setups rely on balanced cables to achieve superior signal-to-noise ratios through differential signaling, which effectively cancels out common-mode noise picked up from external interference sources. Audio interfaces excel in this area by providing XLR connections that support balanced signaling, whereas sound cards typically rely on unbalanced 3.5mm connections that are more susceptible to noise interference.
Dynamic Range and Its Impact on Audio Detail
When I first started paying attention to audio specifications, I’ll admit that dynamic range seemed like just another technical buzzword until I experienced the difference firsthand.
Dynamic range measures the difference between your system’s quietest and loudest sounds, typically expressed in decibels, and it dramatically affects what you’ll actually hear in your music.
You’ll notice this most clearly when comparing streaming services that use heavy dynamic range compression versus high-quality recordings with natural dynamic range expansion. That compression makes everything sound consistently loud but removes the subtle whispers and dramatic crescendos that create emotional impact.
Wide dynamic range preserves those essential details-the soft brush on cymbals, the room ambiance, the explosive drum hits-that transform flat audio into something genuinely engaging and lifelike.
Dynamic microphones excel at handling high Sound Pressure Levels without distortion, making them particularly valuable for capturing audio with natural dynamic range.
For optimal audio capture and playback, look for equipment that maintains a dynamic range specification of 106dB or higher to prevent distortion across all sound levels.
Total Harmonic Distortion: When Numbers Don’t Tell the Whole Story
While dynamic range tells you how much detail you’ll hear between the softest and loudest sounds, total harmonic distortion (THD) measures something entirely different-how much your audio equipment adds unwanted frequencies that weren’t in the original recording.
I’ve encountered numerous THD misconceptions over the years, particularly the belief that lower numbers always mean better sound quality. THD measurement methods typically involve feeding pure sine waves through equipment and analyzing the harmonic content that emerges.
Lower THD numbers don’t automatically translate to superior sound quality-a common misconception that overlooks how our ears actually perceive harmonic distortion.
Here’s what you need to understand about THD:
- A 0.01% THD doesn’t guarantee better sound than 0.1% THD
- Tube amplifiers often measure worse but sound more pleasing
- Noise contamination in measurements skews real-world comparisons
- Higher-order harmonics affect perception differently than lower ones
- Listening tests matter more than specifications alone
Intermodulation Distortion: The Hidden Audio Quality Killer
While you’ve likely heard of THD and understand its impact on audio quality, there’s another distortion type that’s perhaps more damaging to your listening experience: intermodulation distortion, or IMD.
Unlike harmonic distortion which creates musically related overtones, IMD generates harsh, dissonant frequencies when two or more audio signals interact within nonlinear components like amplifiers, speakers, or digital processors.
I’ll show you how to identify IMD in specifications, explain the measurement techniques manufacturers use to quantify it, and share practical strategies for minimizing its effects in your audio system.
What Is IMD
Audio enthusiasts often obsess over harmonic distortion specifications, but there’s a more insidious villain lurking in your system that can absolutely destroy sound quality without you even realizing it’s there.
Intermodulation distortion (IMD) occurs when two or more frequencies interact within nonlinear audio components, creating entirely new frequencies that weren’t part of your original recording. Unlike harmonic distortion, which generates predictable overtones, intermodulation causes generate sum and difference frequencies that fall outside the harmonic series, making them particularly jarring to your ears.
Here’s what makes IMD so destructive to audio clarity:
- Creates muddy, rough textures that mask musical details
- Generates unnatural frequencies not present in original performances
- Causes listener fatigue during extended listening sessions
- Blurs stereo imaging and instrument separation
- Affects bass frequencies most noticeably below 100Hz
This is why producers and music creators prioritize headphones with wide frequency response ranges from 20 Hz to 40 kHz, as these models can reveal IMD artifacts that would otherwise remain hidden in the mix. Professional studio monitors use Class AB amplification to minimize these distortion artifacts while maintaining the warm, accurate sound reproduction that audio engineers depend on for critical listening applications.
IMD Measurement Methods
Since intermodulation distortion can wreak havoc on your system’s sound quality, understanding how it’s measured becomes essential for making informed equipment choices, though the various testing methods can seem overwhelming at first glance.
The most common measurement techniques include the MOD method, which uses two selectable-frequency tones to analyze 2nd through 5th order distortion products, and the DFD method, which applies closely spaced frequencies of equal amplitude. For audio equipment, you’ll typically encounter the IEC60268/3 standard, while RF amplifiers rely on different approaches entirely.
I find that two-tone stimulus signals form the foundation of most intermodulation distortion testing, allowing engineers to identify nonlinear behaviors that single-tone harmonic tests might miss completely in your equipment.
Minimizing IMD Effects
Now that you understand how IMD gets measured, I’ll show you the practical strategies that can dramatically reduce these unwanted artifacts in your audio system.
The most effective approach starts with proper driver design, where manufacturers must carefully engineer linear suspension components to minimize mechanical nonlinearities that create intermodulation distortion.
Here’s what you can do:
- Choose speakers with uniform magnetic flux designs and minimal voice coil inductance variations
- Look for drivers with motion-control technologies that limit cone excursion to linear ranges
- Optimize your crossover settings to reduce mechanical stress on individual drivers
- Consider digital signal processing to actively cancel IMD products, especially at low frequencies
- Design enclosures that minimize non-linear responses throughout the audio chain
These strategies work together, creating cleaner sound reproduction.
Sample Rate Specifications: Finding the Sweet Spot for Digital Audio
When I first started working with digital audio, I’ll admit I was completely baffled by sample rate specifications-those mysterious numbers like 44.1 kHz and 96 kHz that seemed to spark heated debates among audio engineers about which one delivered the “best” sound quality.
Through years of experience, I’ve learned that effective sample rate comparison isn’t about chasing the highest numbers, but understanding the Nyquist Theorem‘s practical implications for your specific needs.
For ideal recording, 44.1 kHz captures the full human hearing range up to 22.05 kHz, while 48 kHz serves as the industry standard for video production.
Higher rates like 96 kHz offer theoretical advantages but dramatically increase file sizes and processing demands, making them practical mainly for archival work or when you’re planning significant post-production manipulation.
Lower sample rates below these standards can introduce aliasing distortion, which compromises the integrity of your final recording and should be avoided in professional applications.
Bit Depth: How More Bits Translate to Better Sound
The mathematics behind bit depth might seem intimidating at first glance, but I’ve found that understanding this specification becomes surprisingly straightforward once you grasp what those numbers actually represent in your audio files.
Bit depth determines your audio resolution by controlling how many amplitude values each sample can contain, directly affecting the noise floor and your system’s ability to capture dynamic nuances.
Think of bit depth as your audio’s resolution dial-more bits mean finer detail capture and lower noise floors during recording.
Here’s what different bit depths offer:
- 16-bit provides 65,536 amplitude levels with 96 dB dynamic range
- 24-bit expands to 16.7 million levels with 144 dB range
- Higher bit depth reduces background noise, not clarity
- Professional recording benefits more than casual playback
- File sizes increase considerably with each bit depth jump
While 24-bit won’t make your music sound sharper, it preserves subtle details during recording and mixing processes.
The Truth About High-Resolution Audio Formats
You’ve probably heard marketing claims about high-resolution audio delivering “studio-quality” sound, but understanding what sample rates and bit depths actually do requires separating legitimate technical benefits from industry hype.
When I first started testing hi-res formats years ago, I discovered that while 24-bit/96 kHz files genuinely capture more audio detail than standard CDs through increased sample rates and expanded dynamic range, the audible improvements aren’t always as dramatic as manufacturers suggest.
The real story behind high-resolution audio lies in how these higher specifications, particularly sample rates above 44.1 kHz and bit depths beyond 16-bit, create measurable differences in sound reproduction that may or may not translate to noticeable improvements in your listening experience.
Sample Rate Benefits
How often have you wondered if those expensive high-resolution audio files actually deliver the superior sound quality that manufacturers promise?
While the sample rate advantages aren’t always audible to casual listeners, they offer genuine benefits for digital audio precision during production workflows.
Here’s where higher sample rates actually matter:
- Audio processing flexibility – Time-stretching and pitch-shifting maintain better fidelity at 96 kHz
- Reduced aliasing – Less filter-induced distortion during analog-to-digital conversion
- Professional workflows – Lower processing latency in digital consoles and live equipment
- Creative sound design – Granular synthesis benefits from finer detail and manipulation control
- Future-proofing – Archival recordings preserve maximum detail for unknown future technologies
I’ll admit, you won’t hear dramatic differences during playbook, but producers genuinely benefit from these enhanced capabilities.
Professional audio interfaces support 24-bit/192kHz resolution, providing the high-quality digital conversion necessary to take full advantage of these sample rate benefits. These specifications are coupled with ultra-low-noise preamps that can deliver up to 69 dB of gain for pristine signal capture.
Bit Depth Impact
While sample rates grab most of the marketing attention, bit depth quietly handles the heavy lifting when it comes to capturing the full range between whispered vocals and thunderous drums in your recordings.
Think of bit depth as your audio’s resolution for volume levels, where 16-bit provides 65,536 distinct amplitude steps, while 24-bit jumps to over 16 million possibilities. This dynamic range influence becomes essential during recording sessions, giving you headroom to push levels without clipping, though honest bit depth comparisons reveal diminishing returns for playback.
Your ears can barely distinguish between 16-bit and 24-bit during casual listening, since 16-bit already delivers 96 dB of dynamic range-exceeding most home environments.
Save the higher bit depths for production work, not your playlist.
Speaker Sensitivity: Matching Efficiency to Your Setup
The quest for perfect audio often hinges on a single specification that many enthusiasts overlook, yet it’s arguably the most vital factor in determining whether your speakers and amplifier will work harmoniously together.
Speaker sensitivity measures how efficiently your speakers convert electrical power into sound, typically expressed as dB @ 1W/1m. Different speaker types exhibit vastly different sensitivity ratings due to their design and acoustic impedance characteristics.
Here’s what you need to know:
- Higher sensitivity speakers (above 90 dB) require less amplifier power to reach desired volume levels.
- A 3 dB difference represents double the acoustic output at the same power input.
- Mismatched sensitivities create unbalanced soundstages and uneven volume distribution.
- Low-power amplifiers pair best with high-sensitivity speakers for peak performance.
- Room size and listening preferences should guide your sensitivity requirements.
Power Requirements: Getting the Most From Your Amplifier
Power matching represents the critical bridge between your amplifier’s capabilities and your speakers’ potential, and I’ve seen countless audio enthusiasts struggle with distorted sound simply because they didn’t understand this fundamental relationship.
Your amplifier selection should provide 1.5 to 4 times your speakers’ continuous power rating, ensuring clean dynamics without clipping distortion that damages components over time.
Impedance matching directly affects power allocation, since amplifiers deliver less power as speaker impedance increases-that 600-watt amplifier at 4 ohms might only produce 400 watts at 8 ohms.
I recommend checking specifications under realistic conditions, focusing on RMS power ratings rather than misleading peak numbers, while considering your typical listening levels and venue requirements for ideal speaker compatibility.
Crosstalk Measurements: Preserving Stereo Separation
Although most audio enthusiasts obsess over amplifier power ratings and speaker specifications, I’ve discovered that crosstalk measurements often reveal more about your system’s actual stereo imaging capabilities than many other specs combined.
You’ll find that channel isolation directly affects how clearly you can distinguish individual instruments across the soundstage, making it essential for serious listening.
Here’s what you should know about crosstalk thresholds:
- Excellent performance measures around -100 dB, delivering near-perfect separation
- Good quality hits -80 dB, sufficient for high-end listening experiences
- Average levels around -60 dB work for casual listening but show noticeable bleed
- Poor separation above -60 dB creates muddy, compressed stereo imaging
- Most listeners can’t distinguish improvements beyond -30 dB in typical environments
Understanding these benchmarks helps you evaluate equipment more effectively than focusing solely on power specifications.
Phase Response: Timing Matters in Audio Reproduction
Most audiophiles I’ve encountered focus intensely on frequency response curves while completely overlooking phase response measurements.
Yet I’ve found that phase characteristics often determine whether your system delivers crisp, coherent sound or muddy, smeared audio that lacks definition.
Phase response measures when signal components arrive at your ears, which directly affects transient accuracy and imaging precision.
Poor phase coherence between drivers creates destructive interference, causing frequency dips and spatial confusion that’ll leave you wondering why your expensive speakers sound disappointing.
Time alignment becomes critical in crossover regions where multiple drivers operate simultaneously, as even small timing discrepancies can blur instrumental details and collapse soundstage depth, transforming what should be three-dimensional music into flat, lifeless reproduction.
Interpreting Measurement Standards and Test Conditions
How often have you wondered whether those impressive specifications on your audio equipment actually mean what you think they mean? Understanding testing methodologies reveals why identical speakers can show vastly different performance numbers depending on measurement conditions.
Standard compliance isn’t universal-different organizations use varying protocols that affect results considerably.
Here’s what impacts those specs you’re reading:
- Room acoustics dramatically alter measurement accuracy, with reflective surfaces boosting certain frequencies.
- Test environments must meet strict ambient noise limits to guarantee valid electroacoustic testing.
- Standard variations between ANSI, IEC, and ISO create different baseline conditions.
- Output pressure measurements change based on coupler design and mounting procedures.
- Performance characterization depends heavily on equipment calibration and environmental controls.
These factors explain why real-world performance often differs from laboratory specifications.
Prioritizing Specifications Based on Your Listening Needs
When you’re staring at endless rows of specifications, the real challenge isn’t understanding what each number means-it’s figuring out which ones actually matter for your listening habits.
Your listening environment dictates whether you need closed-back headphones for noisy offices or open-back models for quiet home studios, while your usage context determines if portability trumps absolute fidelity.
Audio preferences and personal tastes should guide frequency response priorities-classical listeners benefit from flat, wide ranges capturing nuanced layering, whereas hip-hop fans need emphasized bass response for genre requirements.
Different headphone types excel in specific scenarios, and matching sound signature to your music library proves more valuable than chasing impressive-looking numbers that don’t align with how you actually listen.
Frequently Asked Questions
How Do Room Acoustics Affect the Actual Performance of High-Spec Audio Equipment?
Your room’s acoustics can make or break even the most expensive audio equipment, as untreated spaces create reflections and standing waves that mask detail and distort frequency response.
I’ve witnessed $10,000 speakers sound mediocre in poorly designed rooms, while proper room treatment and strategic speaker placement reveal their true potential.
Without acoustic optimization, you’re fundamentally hearing your room’s sound signature rather than your equipment’s actual performance capabilities.
What’s the Difference Between Measured Specifications and Real-World Listening Experience?
You’ll find that measurement accuracy captures technical performance in controlled lab conditions, while your actual listening experience involves subjective factors like emotional engagement, soundstage imaging, and timbral accuracy that specs can’t quantify.
Your listener preference often prioritizes qualities like warmth, detail retrieval, and instrument separation over raw numbers, since room acoustics, source material quality, and system synergy dramatically alter how those measured specifications translate into real-world sound.
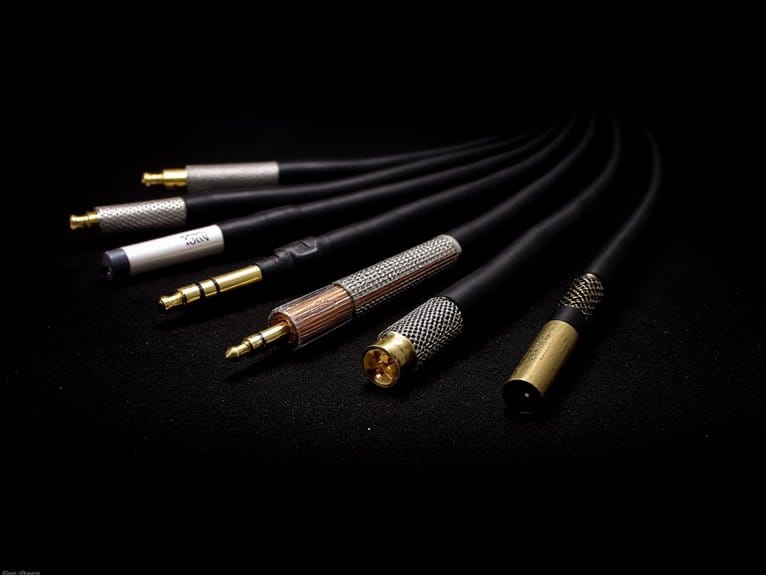
Do Expensive Audio Cables Actually Improve Sound Quality Beyond Basic Specifications?
You’ll find that expensive cables can improve sound quality, though the benefits depend heavily on your system’s quality and your sound perception abilities.
Premium cable materials like silver or gold conductors do reduce signal loss compared to basic copper, while better shielding minimizes interference.
However, I’ve noticed that most improvements are subtle, and you’re often paying exponentially more for diminishing returns beyond well-built, moderately-priced options.
How Much Do Source File Quality and Streaming Compression Affect Equipment Performance?
Source file formats greatly impact your equipment’s performance, with lossless files like FLAC preserving high-frequency details that MP3s lose.
Streaming bitrate effects become noticeable below 160 Kbps, where compression artifacts degrade sound quality regardless of your gear’s capabilities.
I’ve found that high-resolution files only matter if you’re using quality DACs and amplifiers, since your equipment can’t reproduce details that compressed formats have already stripped away.
What Role Does Amplifier Topology Play in Sound Character Beyond Distortion Measurements?
Your amplifier’s topology shapes sound character through its feedback loops, which determine how harmonics are handled, and power supply design, which affects dynamic response and noise floor.
I’ve found that different input stage configurations, like long-tailed pairs versus single-ended designs, create distinct harmonic signatures that you’ll hear as warmth or transparency.
The output stage topology, whether Class A single-ended or push-pull configurations, influences how your amplifier responds to transients and delivers power to your speakers’ varying impedance loads.
On a final note
Now you’ve got the tools to cut through marketing hype and focus on what actually affects your listening experience. Don’t get caught up chasing perfect numbers on paper-trust your ears, prioritize the specs that match your listening habits, and remember that the best-measuring equipment isn’t always the best-sounding. Start with frequency response and signal-to-noise ratio, then work your way through the other measurements as your needs become more specific.